

CPR scoring explained
Understanding the QCPR scoring algorithm
We know good CPR gives higher survival rates, and the idea about scoring is to reflect how good the performance really is for the patient.
Laerdal’s CPR scoring algorithm provides learners with an accurate score on their CPR performance and guides them on how to give even better CPR. But how do you make sense of the numbers behind the score?
How are these scores possible?
How come learner 2 got a better score when
learner 1 had better compression depth?
Learner 1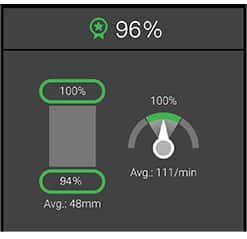
Learner 2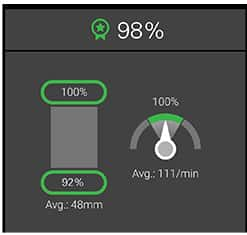
The quick answer is that the top numbers, the overall score of 96% and 98%, are non-binary numbers, measuring how close the learner is to success, calculated across all sub-skills of CPR by Laerdal’s QCPR algorithm. The three other numbers on the screens above are binary, recording only complete success versus fail.
While binary scoring only counts the number of times each individual learner is within the recommended guidelines, Laerdal's non-binary algorithm also calculates how close learners are to the thresholds.
In the example above:
- Learner 1 had 94% OK depth
- Learner 2 had 92% OK depth, lower than Learner 1.
- However, Learner 2 got a higher score.
- The reason is that Learner 2's "wrong" compressions were much closer to the guidelines threshold of 5-6 cm. More on this later.
The overall CPR score is a simple representation of how good the CPR performance was, but the mathematics behind it can be very complex. On this page, we’ll share some insights with you on the principles on how we calculate the score, and also how you can improve CPR learning.
CPR scoring explained
Why do we have CPR scoring?
We know good CPR gives higher survival rates, and the idea about scoring is to reflect how good the performance really is for the patient.
Previously, CPR feedback has been given with a strict approved/non-approved result. Over the last 10 years, Laerdal and our partners have created an algorithm providing a more detailed and granular CPR score. Let’s illustrate with an example:
Example: Meet Julie, a top CPR performer who failed the CPR test
Julie is an emergency nurse in a UK hospital. She is physically fit, and able to provide solid depth of more than 50mm in every compression - all fully released and with absolutely no interruptions. She is one of the best CPR performers we’ve ever seen. Still, after the session, the binary CPR feedback said she had failed. Why?
The rate of her compressions were a consistent 122 compressions per minute. Clinically superb, but just a tiny bit outside of the magic 100-120-limit in the guidelines. Was it fair to tell her she failed? No. If your life was on the line, you’d want Julie to perform CPR on you.
We saw these results all the time when using the old, binary scoring, and this is one of the reasons we made a new algorithm for scoring CPR.
What is binary and non-binary scoring?
While other providers of CPR scoring only use binary numbers, Laerdal uses a non-binary approach to present a more realistic and lifesaving performance review. The simple reason is that while both 49 mm and 25 mm compression depth is outside of the guideline threshold, 49 is undoubtedly, and by far, a much more desired performance.
- Binary scoring: Simply passed or failed. In the introductory example, Learner 1 had 94% of the compression in the correct range of 50-60 mm. The remaining compressions were outside the guidelines. There is no distinction between for example 25 mm and 49 mm. They are both "inadequate".
- Non-binary numbers: The bigger the deviation, the bigger the score reduction. In other words, 49 mm compression depth gives a far better score than 25 mm.
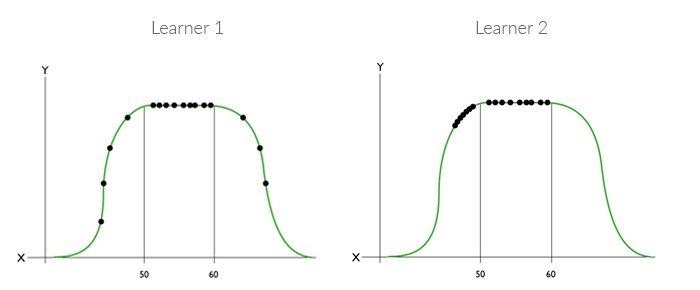
Fig 1. Non-binary scoring.
Learner 1 and 2 have equal amount of compressions inside and outside of the guideline threshold. But Learner 2 get the higher score since compressions outside the thresholds are closer to the guideline. The same principle is used on all other CPR skills. (figure not to scale, for illustrative purposes only)
How is the scoring algorithm made?
The algorithm which makes up the QCPR score is made by Laerdal Medical in close collaboration with members of the AHA ECC Subcommittees and co-authors of the 2013 AHA Consensus Statement on CPR Quality. Based on input from these specialist members, we created mathematical models for each sub-skill in CPR performance, like compression depth, leaning, ventilation volume, etc.
Each compression and ventilation are tracked and scored individually and summed up in the overall score. Even though numbers like average rate can be interesting, averages are not used to calculate the overall score. Similarly, the binary numbers do not affect the score calculation directly.
Subtractive scoring model
The scoring algorithm use a subtractive scoring model where we start off on a perfect score and, if the learners do something wrong, the score is reduced. If you are within the guidelines you will always get a 100% score. If you deviate, the score is reduced.
Plotted along an S-curve, we can see that small deviations give small reductions in the overall score, while large deviations result in large reductions in CPR scores:
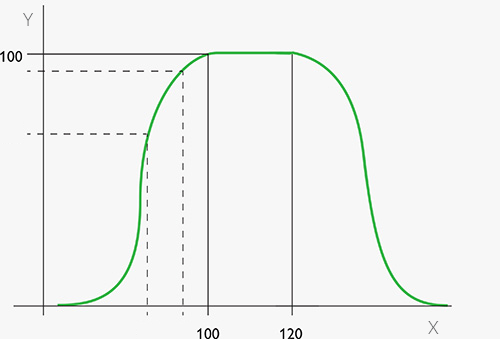
Fig.2 : Compression rate on the x-axis, and score on the y-axis.
We see that the CPR score deteriorates quickly on both sides of the guideline thresholds. (graph not to scale, for illustrative purposes only)
Examples: How can you get a high score with low binary metrics?
A popular feature of our QCPR manikins is the QCPR race where up to six learners can participate in a race to see which one performs the best CPR.
Sometimes we see that while one participant achieves the best score on binary sub-metrics (like adequate depth percentage), another participant will be crowned the winner of the race. The binary sub-metrics (like percentage of adequate depth) will not always help explain the CPR score.
Example 1 - high score with low binary metrics:
Two learner perform 100 compressions. Learner 2 gets a better overall score than learner 1, even though learner 1 had better compression depth if you only look at the binary metrics.
The reason is that learner 2 was closer to the guidelines during the 10 compressions that were not fully "adequate", and learner 1 was very far away from the guidelines during the 8 compressions that were not "adequate".
Example 2 - Ventilations over the limit:
In another example, both learners provide too much air in ventilation and miss the ventilation sub-metric.
Let's say learner 2 gave 610 ml of air (which is clinically OK) and learner 1 provided 2000ml of air, which indeed can compromise the clinical outcome. In binary terms, these results are the same, simply "not adequate". However, in clinical terms, and therefore also in scoring terms, they are very different. Learner 2 was much closer to the guidelines and receives a higher score.
Example: How can you get a low score with high binary metrics?
Sometimes - especially for 'Compressions Only' sessions - the total score is unexpectedly low, even though compression rate, depth, and release are all perfect (see image below).
The score reduction for many of those sessions comes from the chest compression fraction. If your compressions are interrupted, there will be a reduction in the score - longer interruptions give larger score reductions.
Also worth noting, if you are running a ”Compression only” sessions, the expected chest compression fraction is 100%, as you have no good reasons to stop the compressions. So, if there are interruptions, the score is reduced rather strictly.
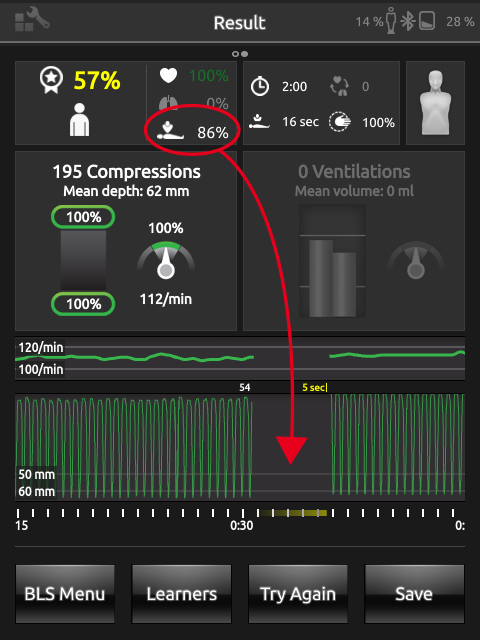
Illustration, Compression only session: Rate, depth, and release are all perfect. However, the total score is unexpectedly low. The culprit is the chest compression fraction parameter.
Which CPR metrics are calculated?
The number of parameters scored depends on which manikin or simulator you use, and which software or application you use.
10 parameters used to calculate QCPR score:
- Compression depth
- Compression rate
- Incomplete release
- Hand position
- Compression per cycle
- Chest compression fraction (also known as flow fraction)
- Ventilation volume
- Ventilation rate
- Number of pre-ventilations
- Inspiration time in pre-ventilations